
Why Coaches Need the Opponent’s Box Score Too
Your own statistics explain only half the game. An opponent box score from the same film reveals matchups, extra possessions, bench impact, and the stretches worth reviewing.
A coach can have a perfectly accurate box score for their own team and still misunderstand the game.
Your players’ totals show what they produced. They do not show who punished a coverage, which opponent changed the pace, or where the other team found its extra possessions. Basketball is an interaction. The record should include both sides.
That is why the opponent’s box score should come from the same game film—not as a separate project, but as part of the standard breakdown.
Your box score tells only one side of each event
Every rebound belongs to a missed shot. Every assist ends in someone’s field goal. Every turnover creates a possession for the other team.
Looking only at your own line can hide the relationship between those events.
Suppose your team committed twelve turnovers. Is that number acceptable? The answer changes if the opponent turned them into repeated transition scores. Suppose your center collected eight rebounds. That looks solid until the opponent’s frontcourt shows six offensive rebounds and several second-chance baskets.
The opponent’s numbers do not merely add information. They complete the meaning of your own.
See where the other team’s production came from
A full opponent box score helps the staff identify:
- The players who carried the scoring load
- Who created extra possessions through offensive rebounds or steals
- Which players reached the free-throw line
- Which bench players added meaningful production
- Where the biggest statistical differences appeared
These are not conclusions by themselves. They are directions for film review.
If an opponent’s reserve scores efficiently or changes the rebounding battle, the staff can open that player’s possessions and ask what changed. Was it pace? Ball pressure? A lineup matchup? A run of difficult shot-making? The box score tells the coach where to look; the film explains why.
Both shot maps reveal the geometry of the game
A shot map for your team shows what your offense produced. Add the opponent’s map and the court becomes a picture of the entire game.
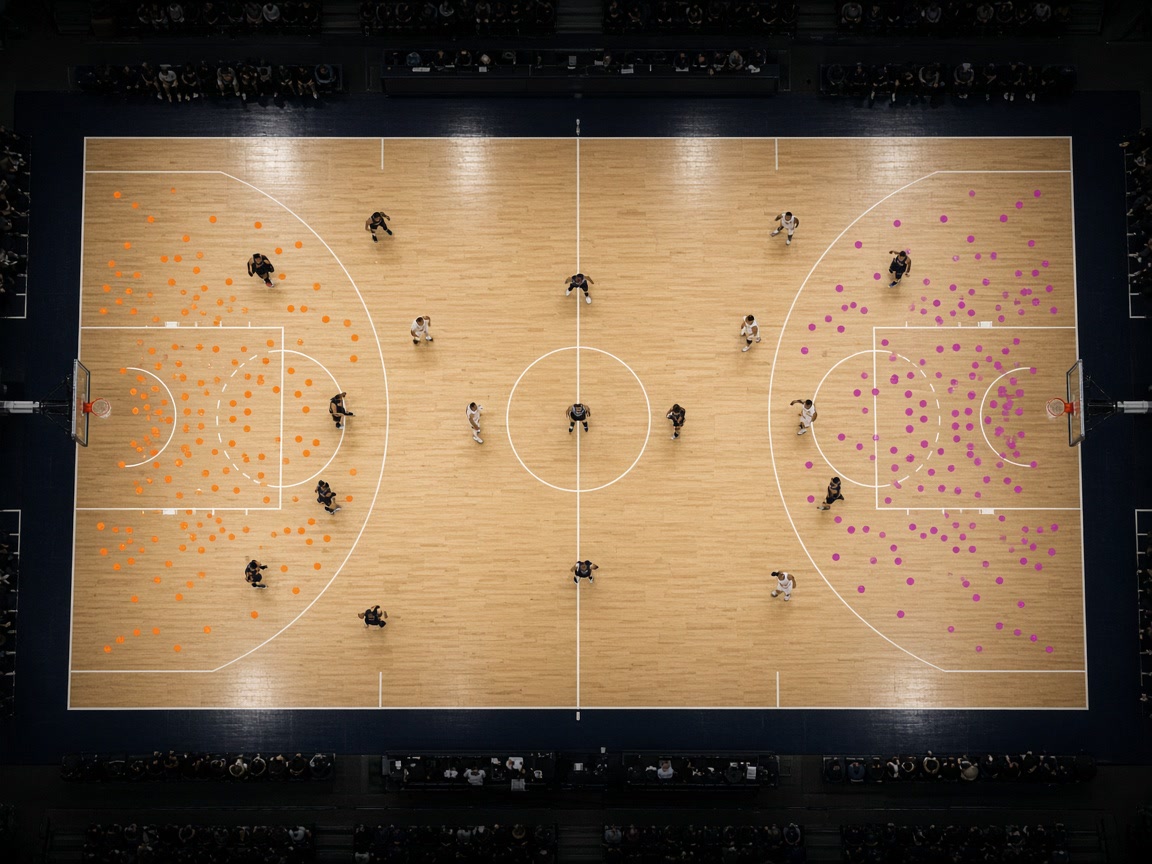
Side by side, the maps can point to questions such as:
- Did one team create more attempts near the basket?
- Which side generated cleaner corner shots?
- Did the opponent repeatedly reach the same zone?
- Did the defensive plan move shots away from the preferred areas?
The answer still requires context. A contested attempt at the rim is not the same as an uncontested layup. But the locations make patterns visible before the staff begins reviewing possession by possession.
Use your lineup data to locate the matchup
Your players’ minutes and plus-minus help identify when the score moved and which of your groups was on the floor.
Imagine your starting group played evenly, but the game changed during the first bench stretch. Your rotation data locates that part of the game. The opponent’s box score points to the players whose production deserves attention, and the film shows which combinations actually met.
That gives the staff a cleaner question: What happened during this stretch, and who created the difference?
The goal is not to overreact to a small plus-minus sample. It is to use the number as an index into the film. A lineup statistic is a clue, not a verdict.
Find the possessions that deserve a second look
Opponent data helps prioritize review in four common areas.
1. Extra possessions
Compare offensive rebounds, steals, and turnovers. The result may have been shaped less by shooting percentage than by one team simply getting more chances.
2. Foul pressure
Identify who reached the line and which defenders were involved. Then review whether the problem came from positioning, late help, a matchup, or transition defense.
3. Bench impact
Look beyond total bench points. Use your own rotation data to locate when the game changed, then use the opponent’s production and the film to understand the source.
4. Shot profile
Compare the zones each team reached. The contrast can show whether the game was played in the areas your plan intended.
This is not the same as an opponent scouting report
An opponent box score from your game explains how that team performed against you that night. It does not automatically describe everything the opponent does across a season.
That distinction matters. A complete scouting report may require several games, tactical classification, personnel tendencies, and a coach’s interpretation. The box score is narrower and immediately useful: it provides the factual record of the matchup you just played.
Honest analysis starts by knowing what the data can and cannot say.
One upload should count the whole game
Manually building a second box score doubles work that should never have been split in the first place. The camera captured all ten players. The breakdown should account for all ten.
With Playtics, one uploaded game returns:
- Your player-by-player box score
- The opponent’s player-by-player box score
- Minutes and plus-minus for your players
- Shot locations by zone
- Highlights per player, per team, and per game
The results come back within a few hours. If something needs correction, the coach or analyst can edit it or ask the staff to fix it.
Understand the result as a matchup
A basketball game is not two separate performances. It is one system of actions and reactions.
Your offense shapes the opponent’s transition opportunities. Their pressure shapes your turnovers. Your lineups meet theirs. Your shot profile exists beside theirs.
The best postgame record respects that reality. It shows both teams, from the same film, so the next conversation begins with the whole game.
Want both sides of the box score from the film you already record? Tell us about your team.