From Final Buzzer to Next Tip: Why Data Matters for Coaches
How coaches can use basketball analytics and AI video analysis to turn game film into evidence, better practices, and a clearer plan for the next game.
A coach leaves every game with impressions. The team looked rushed. The second unit changed the energy. The opponent found the same opening three times. Those impressions matter—but they are only the beginning.
Data gives the staff a durable record of what happened. Film supplies the context. Coaching turns both into a decision.
That distinction is important. The value of analytics is not the size of a dashboard or the number of metrics collected. It is whether the information helps a coach choose what to review, what to teach, what to practice, and what to test in the next game.
This is the full loop: from the game that just ended to the next one that has not started yet.
Data is evidence, not an answer
Basketball now produces more information than any staff could review possession by possession without a system. The NBA says its player-tracking cameras record every player and the ball 25 times per second. Its newer optical system can identify 29 points on each player’s body 60 times per second to measure concepts such as defensive pressure and off-ball gravity.
More data does not automatically create better decisions. It creates more evidence. A coach still has to decide which evidence matters.
That is why useful analysis begins with a basketball question:
- Are we creating the shots our offense is designed to create?
- Which lineups protect the ball without slowing our pace?
- Are we losing possessions through turnovers, offensive rebounds, or poor transition defense?
- Is a player’s recent shooting slump a shot-quality problem or normal variation?
- What can we change before the next opponent?
A number without a question becomes noise. A question without evidence can become a guess. Coaching improves when the two meet.

Step 1: Preserve the game as it happened
The process starts during the game, not after it.
Film records the possessions. The official scorebook records events. Staff notes preserve context that may not appear in either: a coverage changed, a player was limited, the team lost communication after a timeout, or the opponent abandoned its first plan.
The goal is not to analyze everything from the bench. It is to keep the next review from depending on memory alone. Memory tends to hold onto dramatic moments—a late turnover, a made three, a disputed call—while quieter patterns can decide far more possessions.
Right after the final buzzer, the staff should capture a short list of questions while the game is fresh. Those questions become the starting point for the postgame review.
Step 2: Turn events into a reliable record
Before interpreting the game, the staff needs a trustworthy account of it. That record may include possessions, shots and locations, rebounds, assists, turnovers, fouls, minutes, lineup combinations, plus-minus, and clips linked to the events.
Consistency matters more than novelty. If one game defines a transition possession differently from the next, the season trend becomes unreliable. If corrections cannot be made, confidence in the whole system falls.
This is where structured data earns its first advantage over memory: it makes the game searchable, comparable, and correctable.
The NCAA’s official courtside statistics system reflects that need. NCAA LiveStats captures shot, turnover and foul types, court locations, rotations, player plus-minus, lineup analysis, shot charts, and play-by-play. It also produces reports intended to help coaches make tactical decisions. The lesson is not that every team needs every field. It is that context changes what a basic total means.
Step 3: Measure possessions, not just totals
Raw totals can mislead because games are played at different speeds. A team that scores 80 points in a fast game may have been less efficient than a team that scores 68 in a slower one.
That is why possession-based measures matter. The NCAA’s NET system defines adjusted net efficiency as the difference between offensive efficiency and defensive efficiency—both measured in points per possession—while accounting for opponent strength and game location.
Coaches do not need to recreate the NET formula. They do need to understand the principle: compare teams and games on the same scale.
Possession-based questions are often more useful:
- How many points did we produce per trip?
- How many extra possessions did turnovers and offensive rebounds create or surrender?
- Did a lineup’s advantage come from shooting, ball security, rebounding, or free throws?
- Did our defense force difficult attempts, or did the opponent simply miss open ones?
The scoreboard reports the result. Possession data begins to explain the route to it.
Step 4: Compare the game with a baseline
One game is a sample, not an identity.
A player can make five difficult shots and still take poor shots. A team can defend well and watch an opponent make contested jumpers. It can also win while repeating a problem that a stronger opponent will punish.
The staff should compare the game with useful baselines:
- The team’s season average
- The previous five games
- Home and road performance
- Similar opponents
- The same lineup in comparable minutes
- The player’s own role and historical range
The purpose is not to dismiss the latest game. It is to separate a repeatable pattern from a one-night outcome.
Research shows why a combination of indicators is stronger than one favorite stat. A peer-reviewed study using 4,100 games across 10 Chinese Basketball Association seasons identified effective field-goal percentage, three-point percentage, two-point percentage, offensive-rebound percentage, defensive rebounds, and turnover percentage among the key indicators associated with results. Winning was not explained by scoring alone.
For a coach, the practical message is simple: inspect how possessions were created, protected, and finished.
Step 5: Return from the number to the film
Data tells the staff where to look. Film helps explain why the pattern exists.
Suppose the shot chart shows too few attempts at the rim. The number does not say whether the cause was poor spacing, missed cuts, a conservative ball-screen coverage, or guards declining driving lanes. Suppose turnovers rose. Film separates bad passes from spacing errors, offensive fouls, and late-clock desperation.
A useful review moves in both directions:
- A number reveals a pattern.
- The staff opens the relevant possessions.
- Film reveals the basketball cause.
- The cause determines the teaching point.
This prevents two common mistakes: using statistics without context and using a few memorable clips as if they represent the whole game.
Step 6: Reduce the findings to coaching priorities
An analysis can be correct and still be unusable. Players cannot carry fifteen corrections into practice, and a staff cannot redesign the team between every game.
The coach’s job is compression: turn the full record into a small number of priorities.
A practical postgame summary might contain:
- One thing to keep: an action or lineup that produced repeatable advantages
- One thing to correct: the highest-cost breakdown the team can realistically change
- One individual focus: a clear responsibility for a player or position group
- One opponent implication: something the next team is likely to test
The best priority is not always the largest number. It is the finding that is both important and coachable before the next tip.
Step 7: Build practice from the evidence
Data should change practice design, not merely decorate the film meeting.
If the team allowed repeated offensive rebounds from the weak side, the response may be a shell drill with explicit hit-and-find assignments. If guards struggled against pressure, the staff may add constrained possessions that begin with a trap. If a lineup created good shots but missed them, the right response may be repetition and confidence—not an offensive overhaul.
This is also where physical-load information can support basketball judgment. A 2024 systematic review examined 14 basketball studies on training load and injury risk; 11 reported at least partially significant relationships. The authors found a clear relationship overall, but the studies did not support treating one workload number as a universal prediction tool.
That nuance matters. Data can help coaches individualize practice volume and recovery. It should not turn uncertainty into false precision. Availability, medical guidance, player feedback, schedule, and role all remain part of the decision.
Step 8: Convert practice into a next-game plan
By the day before the next game, the staff should be able to connect each priority to a specific behavior.
Instead of “rebound better,” the plan might be: the low defender hits first, the weak-side wing cracks down, and the guard releases only after possession is secured.
Instead of “take better shots,” it might be: create a paint touch before the first contested pull-up, attack the opponent’s drop coverage, and track corner-three opportunities.
The plan also needs a way to evaluate itself. Decide in advance which signals will matter during and after the game:
- Turnover rate against pressure
- Opponent offensive-rebound percentage
- Paint touches leading to shots or kick-outs
- Shot profile by zone
- Performance of the lineup assigned to a matchup
This turns analysis into a testable coaching plan rather than a retrospective explanation.
Step 9: Close the loop in the next game
The next game is not the end of the process. It is the next measurement.
Did the correction survive game speed? Did the opponent force a different response? Did the targeted lineup improve the problem without creating another one? Did the team execute the intended behavior even if the shots did not fall?
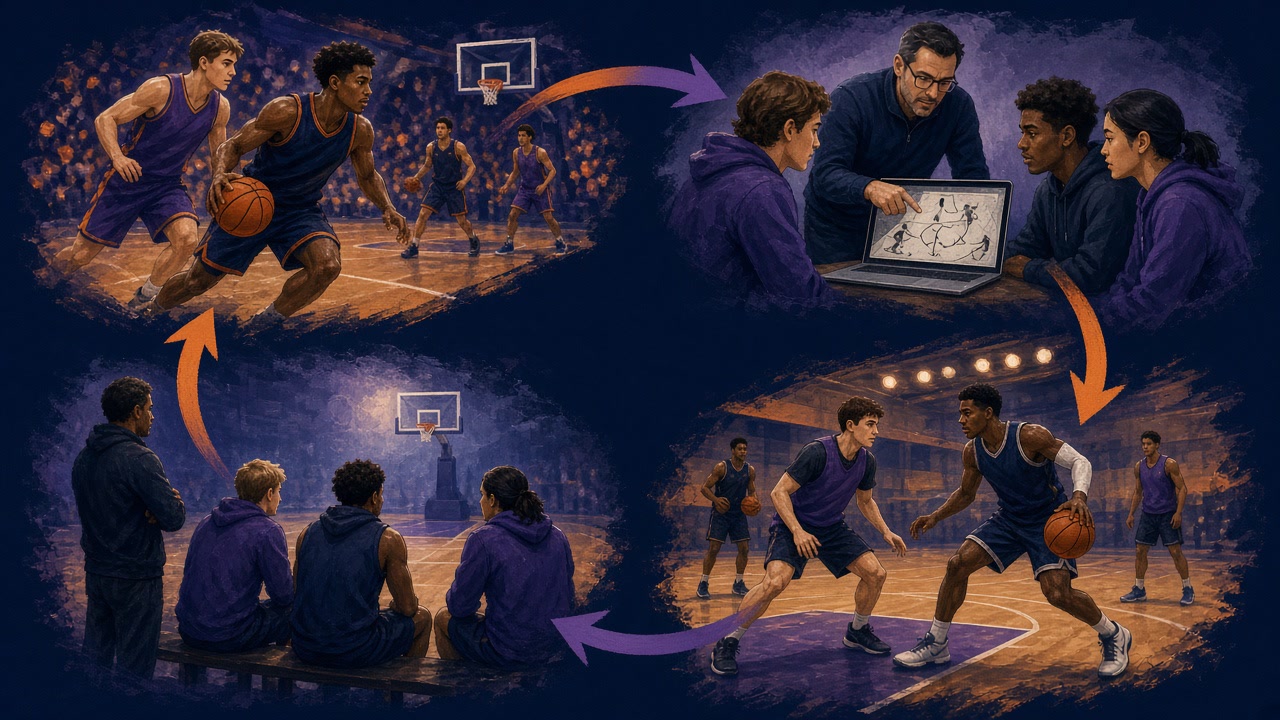
This is where season-long data becomes more valuable than an isolated report. Each game updates the baseline. Each practice tests a response. Each next game shows whether the response transferred.
The loop becomes:
Game → reliable record → comparison → film context → coaching priority → practice design → game plan → next game.
Over time, this creates organizational memory. A staff can see not only what happened, but what it tried, what changed, and which lessons held up against different opponents.
Use the smallest amount of data that changes the decision
Basketball analytics should not make coaching feel more complicated. It should help the staff spend its limited attention on the decisions that matter most.
There is good reason to stay disciplined. An umbrella review covering 24 systematic reviews and meta-analyses in team-sport match analysis rated 12 of them “critically low” for methodological quality. Not every polished metric is dependable, and correlation does not automatically reveal cause.
A healthy data culture therefore asks:
- Is the data accurate and consistently defined?
- Is the sample large enough for the conclusion?
- Does the comparison account for pace, opponent, role, and lineup context?
- Can the staff connect the pattern to film?
- Is there a realistic coaching action attached to it?
- What result would prove the decision wrong?
Good coaching is not replaced by data. It becomes more deliberate because the staff can test its beliefs against a record.
The real value is the next decision
The final box score belongs to the game that ended. The real value of the data belongs to the next possession, the next practice, and the next game.
When the process works, coaches spend less time debating what happened and more time deciding what to do about it. Players receive specific teaching instead of vague criticism. Practice reflects the team’s actual needs. The next game plan carries a small number of measurable priorities.
That is why data matters: not because basketball can be reduced to numbers, but because better evidence helps coaches ask sharper questions—and make the next decision with greater clarity.
Questions coaches ask when looking for basketball analysis software
Coaches often search for a tool only after the current process becomes too slow: the next game is approaching, the film is still untagged, and the staff needs answers rather than another place to store video. These are the practical questions worth asking.
How can a coach analyze basketball game film faster?
The fastest useful process is to start with an automatically organized game: player and opponent statistics, shot locations, minutes, plus-minus, and clips linked to the action. The coach can then move directly from a statistical pattern to the relevant possessions instead of scrubbing through the full recording or rebuilding the box score by hand.
Speed alone is not enough. The output must be reviewable and correctable so the staff can trust what it shares with players.
What should AI basketball video analysis give a coach?
A useful AI basketball video analysis platform should return more than a highlight reel. At minimum, it should help the staff answer four questions:
- What happened? A reliable box score for the team and opponent.
- Where did it happen? Shot locations and possession context.
- Who was involved? Player minutes, lineups, plus-minus, and individual clips.
- What should we review? A direct path from a pattern in the data to the relevant film.
The software should organize evidence. The coach should remain responsible for interpretation, teaching, and the game plan.
Can basketball analytics work with video from an ordinary camera?
Yes—if the platform is designed for uploaded game film rather than requiring permanent tracking hardware in the gym. That distinction matters for college, high-school, academy, and club programs that play in different venues or already have a camera workflow.
Before choosing a solution, coaches should confirm the accepted camera angles and file formats, the expected turnaround time, and whether mistakes can be corrected.
How is Playtics different from simply storing game video?
A video library preserves the recording. Playtics turns the recording into an organized game record. Coaches upload film from the camera they already use and receive player-by-player statistics for both teams, shot locations by zone, minutes, plus-minus, and player, team, and game highlights within a few hours.
The staff can review the results, edit them when necessary, and use the connected data and film to prepare practice and the next game. The purpose is not to replace the coach’s judgment. It is to let that judgment begin with the game already organized.
What should a coach compare before choosing a platform?
Look beyond the length of the feature list. Compare the parts that determine whether the tool will survive a full season:
- Input: Does it work with the cameras and venues the team already uses?
- Turnaround: Will the analysis arrive before the next film session or practice?
- Coverage: Does it include both teams, every player, shot locations, minutes, and clips?
- Accuracy: Can the staff review and correct the record?
- Continuity: Does each game add to a useful season history?
- Usability: Can coaches and players get from a number to the matching video quickly?
- Ownership: Can the staff use and share its analysis without losing control of the workflow?
The best basketball analytics software is not the one that produces the most data. It is the one that reliably changes the next coaching decision.
Sources
- NBA Stats FAQ: Player Tracking
- NBA: Introduction to the Gravity stat
- NCAA LiveStats overview
- NCAA: How NET rankings work
- Explaining basketball game performance with SHAP: insights from 4,100 CBA games
- The relationship between training load and injury risk in basketball: a systematic review
- Match analysis in team ball sports: an umbrella review
If that is the workflow your staff is looking for, book a Playtics demo and show us how your team records games.